Telling Technology · Learning in public
All episodes
EP.29 — SERVICES
Live service monitoring, in the dashboard

My AI dashboard now shows every service running on my machine — with live port-collision warnings

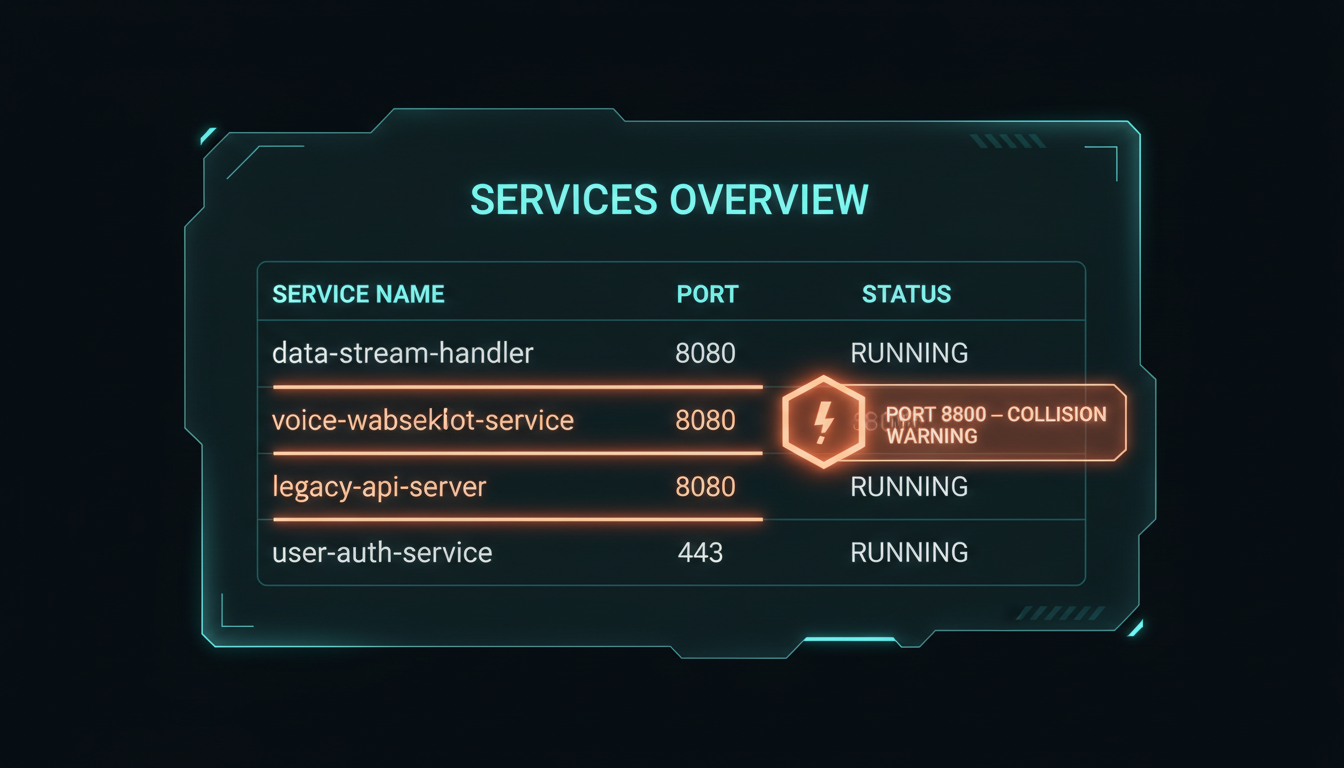
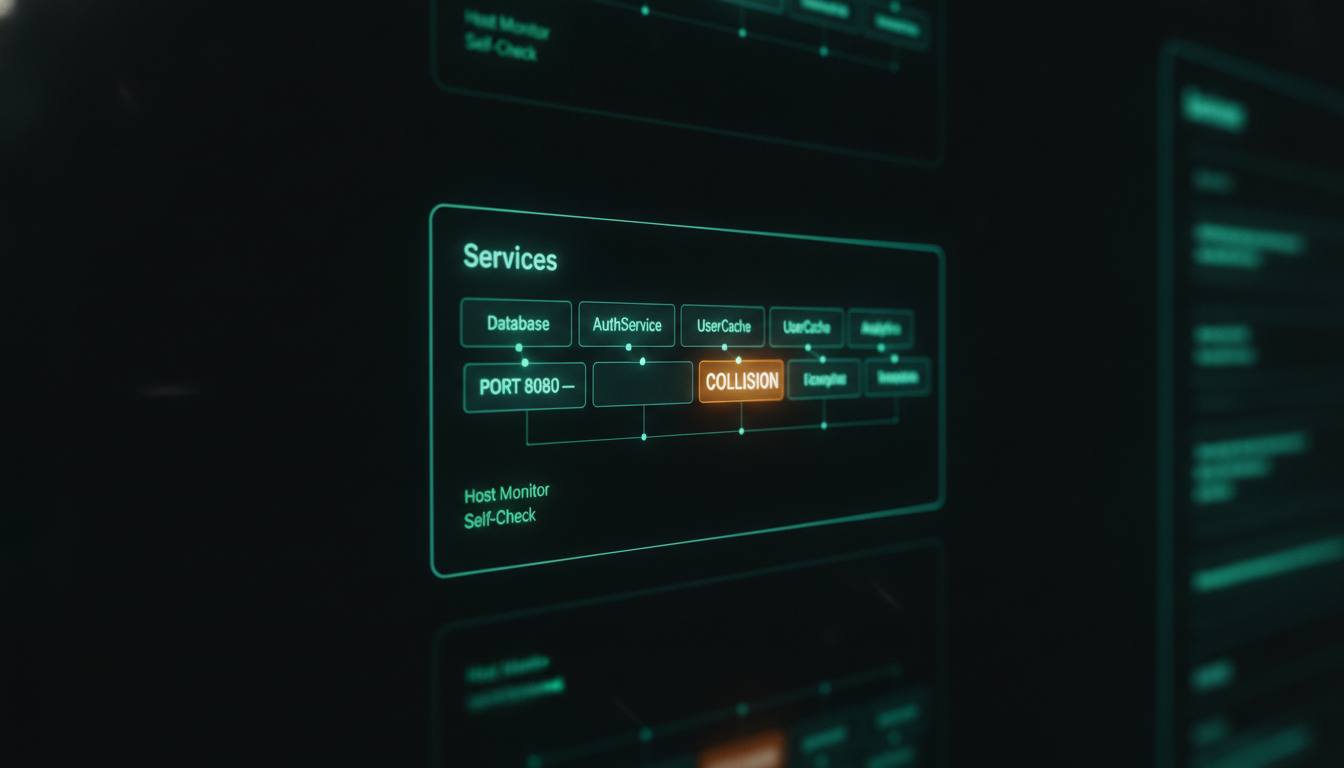
I run a handful of local AI services — a voice server, an API, the dashboard itself — and I never quite knew which were actually up. The honest answer was ps aux | grep python and a squint. So I had Claude add one card that reads every running process, maps it to a service and its port, and warns the moment two of them fight over the same one. It caught a real collision — voice WebSocket and an old API server both on 8080 — the instant the card loaded.
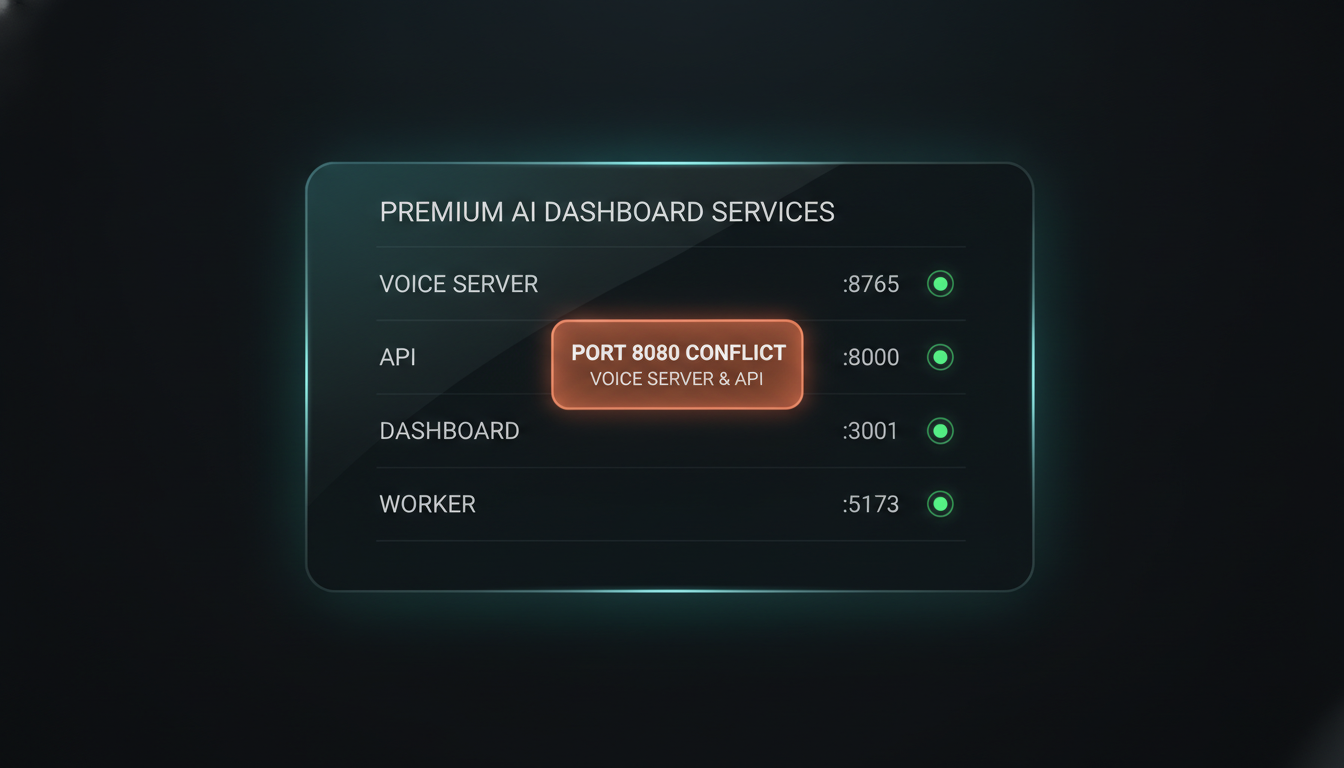
The AI dashboard Services card listing four local AI services — voice server, API, dashboard, worker — each with a status dot and port label, one row flagged with an amber port-collision warning badge, house aurora-teal style
⌁ live processes · PID → service → port · collision flagged
First: the only way I knew what was running was ps aux and hope
01 The problem · ps aux and hope

I never actually knew which services were up

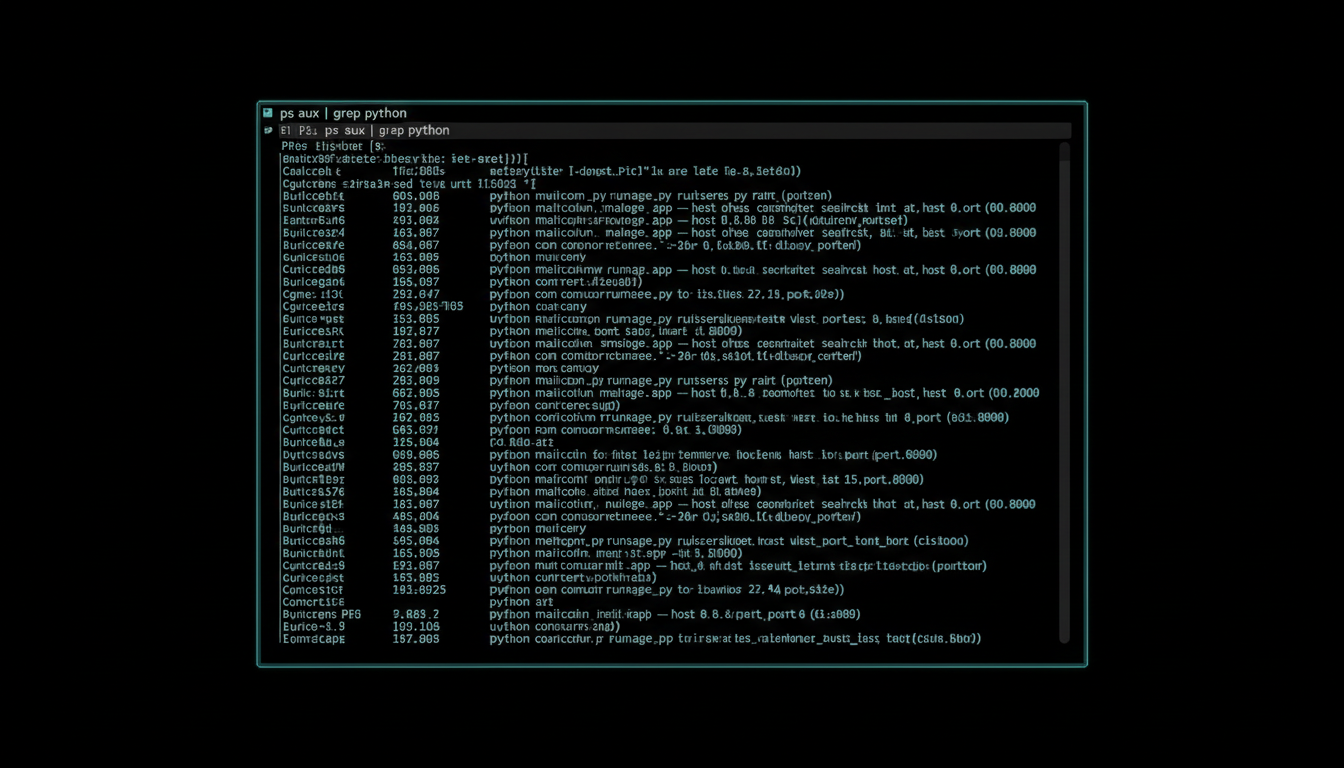
Running several local AI services at once means the truth lives in your process table, not your head. Was the voice server still up? Did the old API die, or just go quiet? My routine was ps aux | grep python, read the wall of rows, and guess. No single place showed what was running, on which port, right now. The dashboard had cards for everything except the one thing I checked most.

claude code — desktop
> my dashboard shows projects, sessions, tokens — but not what's actually running. add a card that reads the live processes on this machine, maps each to a service name, and shows its port. no more ps aux | grep python.
I'll add a Services card backed by a route that reads the live process list, maps each PID to a known service, and surfaces its listening port + status. One glance instead of a terminal sweep — and it refreshes on its own.
A cluttered terminal showing ps aux | grep python output — many rows of python and uvicorn processes with no clear mapping to services or ports, house aurora-teal style
before · ps aux | grep python
the only "dashboard" I had for running services
02 The build · PID → service → port

One card reads every process, names the service, shows the port

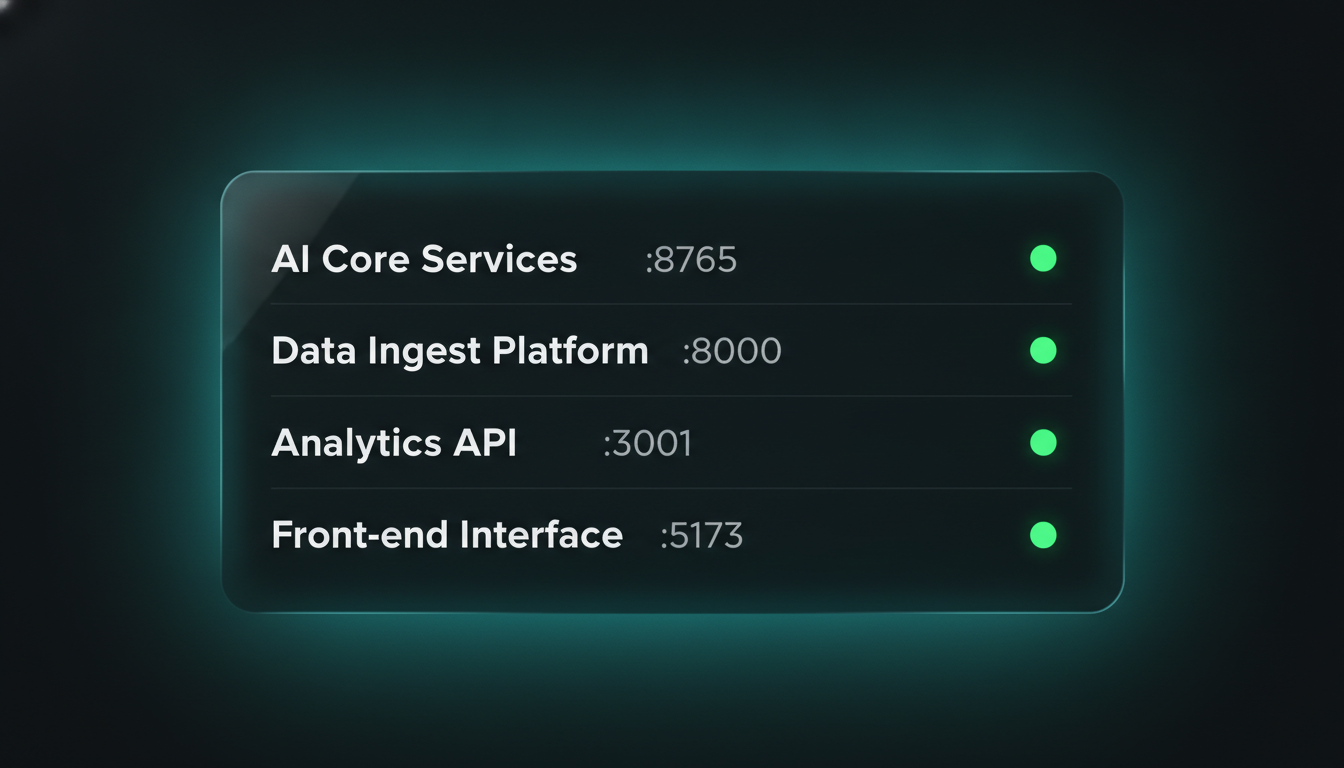
The route walks the live process list, keeps the ones that are actually AI services, and resolves each to a friendly name and its listening port. The card renders them as rows — name, port, status dot — and polls so it stays live. Open the dashboard and the answer to "what's running?" is just sitting there: voice server on its port, API on its, dashboard on its, each green when healthy.

claude code — desktop
> for each service show name, listening port, and a status dot. poll it so it stays current. read the port from the process itself — don't hardcode it.
Card lists each service with its resolved port and a live status dot, refreshed on an interval. Ports come from the process's own listening socket — nothing hardcoded, so a service that moves ports still shows the truth.
The finished Services card in the AI dashboard — four rows (voice server, API, dashboard, worker) each with a name, port label and green status dot, house aurora-teal style
after · live service list
one card: every service, its port, its status
03 The bug · workers masquerading as services

The first version triple-counted — every worker looked like its own service

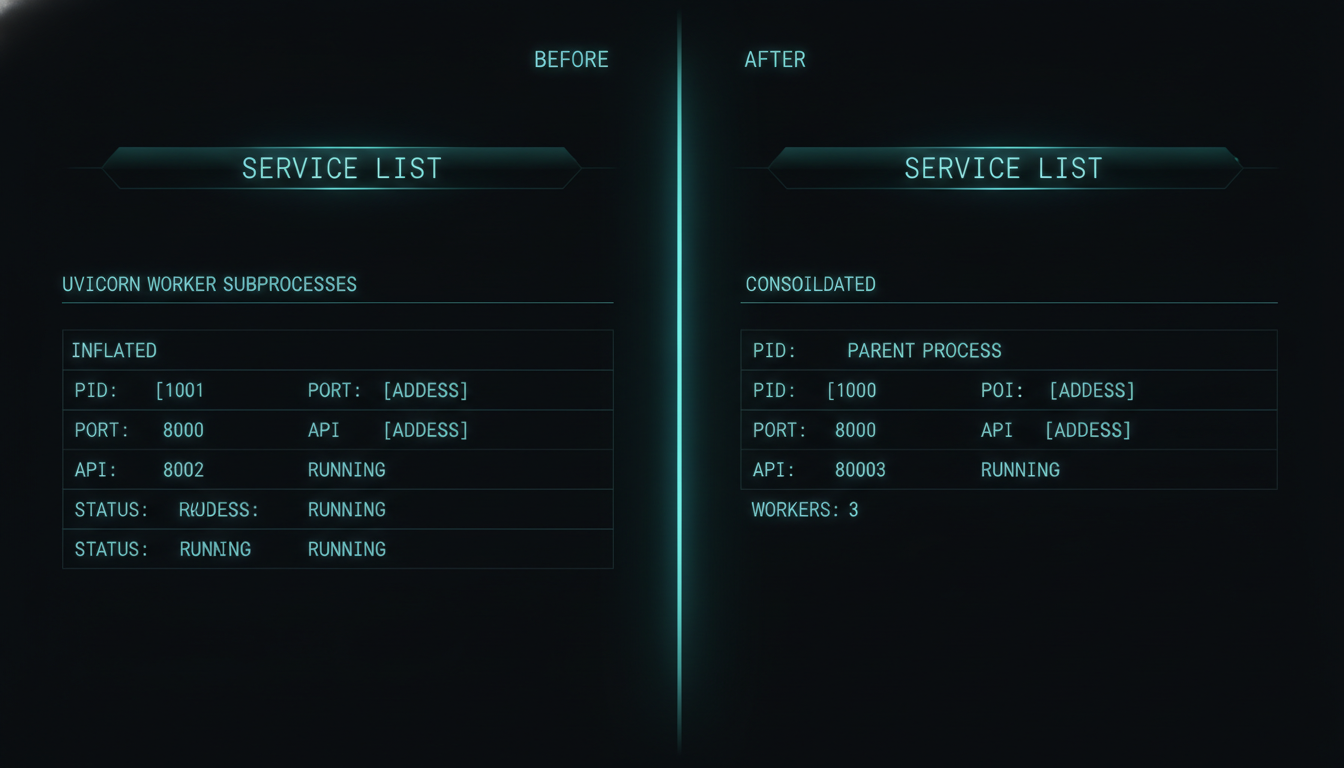
First load, the card lied. It showed three "API" services where there was one. The cause: uvicorn spawns worker subprocesses, and each child PID looked like a separate service to my naive scan. The fix was to collapse the process tree to parent PIDs — group children under the parent that actually owns the port, and count that once. The count went honest, and the ports lined up with reality.

claude code — desktop
> the card shows 3 API services but there's only one — it's counting every uvicorn worker as its own service. collapse the process tree so child workers fold into the parent that owns the port.
Right — those are worker subprocesses, not services. I'll walk parent PIDs and fold children into the owner of the listening socket, so each service counts once. Workers still run; they just stop masquerading as separate services.
A before/after diagram — left, an inflated service list with three identical API rows (one per uvicorn worker); right, the corrected list with a single API row after collapsing child PIDs into the parent, house aurora-teal style
fix · child PIDs → parent
collapse the tree; count the service, not its workers
⚠️

A process count is only as honest as its tree

Easy trap: treating every PID as a service. A modern server is a tree — one parent that owns the port, N workers underneath. Count the leaves and a single API looks like a small fleet. The card only became trustworthy once it counted the thing that binds the port, not every process that shares its name.

04 The receipts

The card, the collision badge, the bug, and the before/after

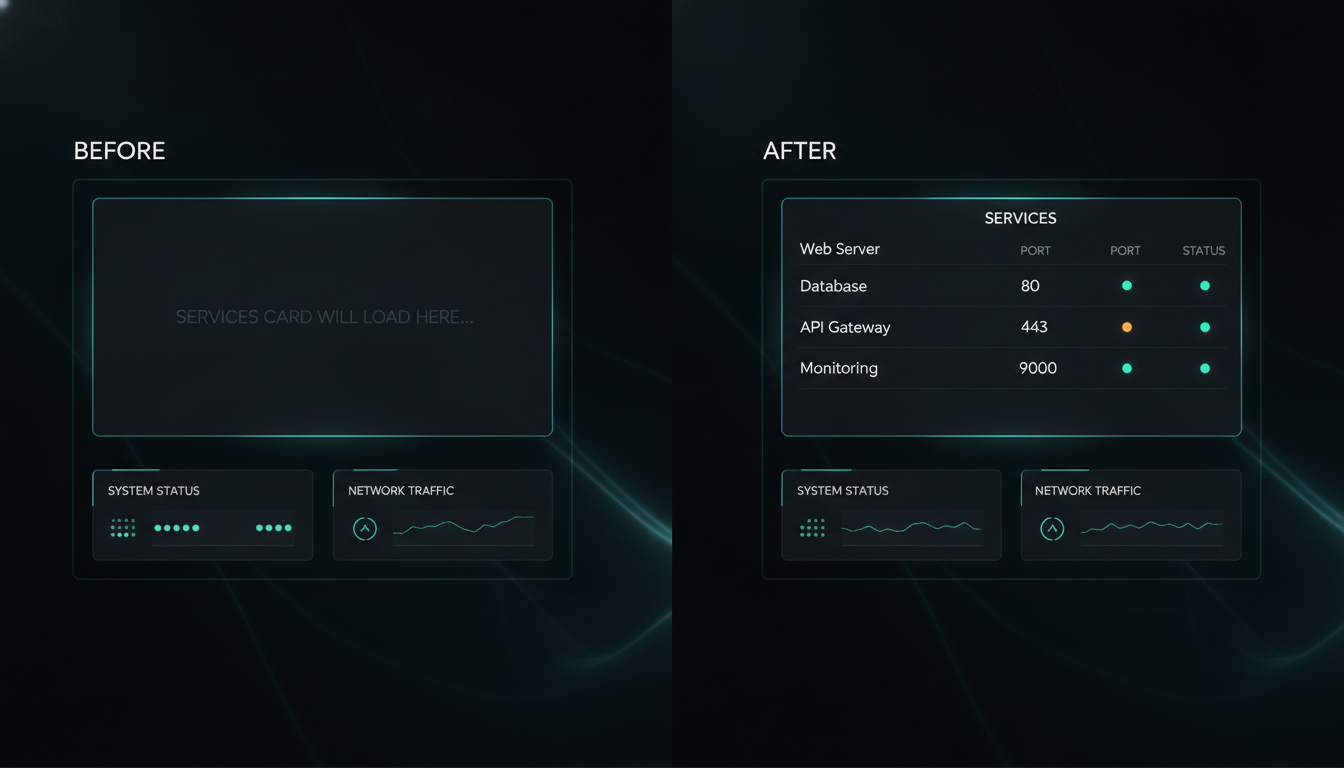
Four outputs from the build: the populated Services card, the port-collision warning that caught a real conflict, the process-tree fix that made the count honest, and the dashboard area before and after the card landed. Tap any image to enlarge it and read the exact prompt that drew it.

RUNNING LIVE ON MY OWN DASHBOARD

It caught two services fighting over port 8080 the moment it loaded

This wasn't a staged demo. The first time the card rendered, it flagged a real collision — my voice WebSocket server and an old API server I'd forgotten to kill, both bound to 8080. No terminal, no ps aux, no guessing: the dashboard told me the moment I looked. The AI built its own monitoring card while running inside the very machine it now watches — including itself.

The Services card live on the AI dashboard with an amber collision badge on port 8080, every other service green, the dashboard monitoring its own host, house aurora-teal style
ps aux → one card · hidden processes → named services · silent conflict → port-collision badge
06 Steal this

Add a live Services card to your own dashboard

The process-reading route, the PID-to-service mapper, the parent-PID tree collapse, and the port-collision check — plus a demo that runs on synthetic processes so you never expose your own host. Everything in this episode is free and open — clone it, run it, make it yours. Repo lands shortly — buttons go live the moment it's public.

route /api/services mapper PID → service fix collapse tree → parent PIDs check port collisions
run it · soon gh repo clone tellingtechnology/dashboard-services-card ~/dashboard-services-card && cd ~/dashboard-services-card && cat README.md

No GitHub? Comment SERVICES on the post and the bot DMs you the repo the moment it's public.

Next episode

The dashboard stopped watching the service that died — and restarted it

Seeing a collision is step one. Next: the card gets an action — when a service goes dark, or two collide, the dashboard doesn't just warn, it offers to kill the stray and bring the right one back, straight from the browser. Monitoring turns into control.

Darkened teaser — the AIOS dashboard gaining a restart action on its Services card, monitoring becoming control, house aurora-teal style
drops next · follow @tellingtechnology so you don't miss it